Speaking & Writing
Insights and reflections from co-founders Cari Tuna and Dustin Moskovitz
Gates Foundation at 25
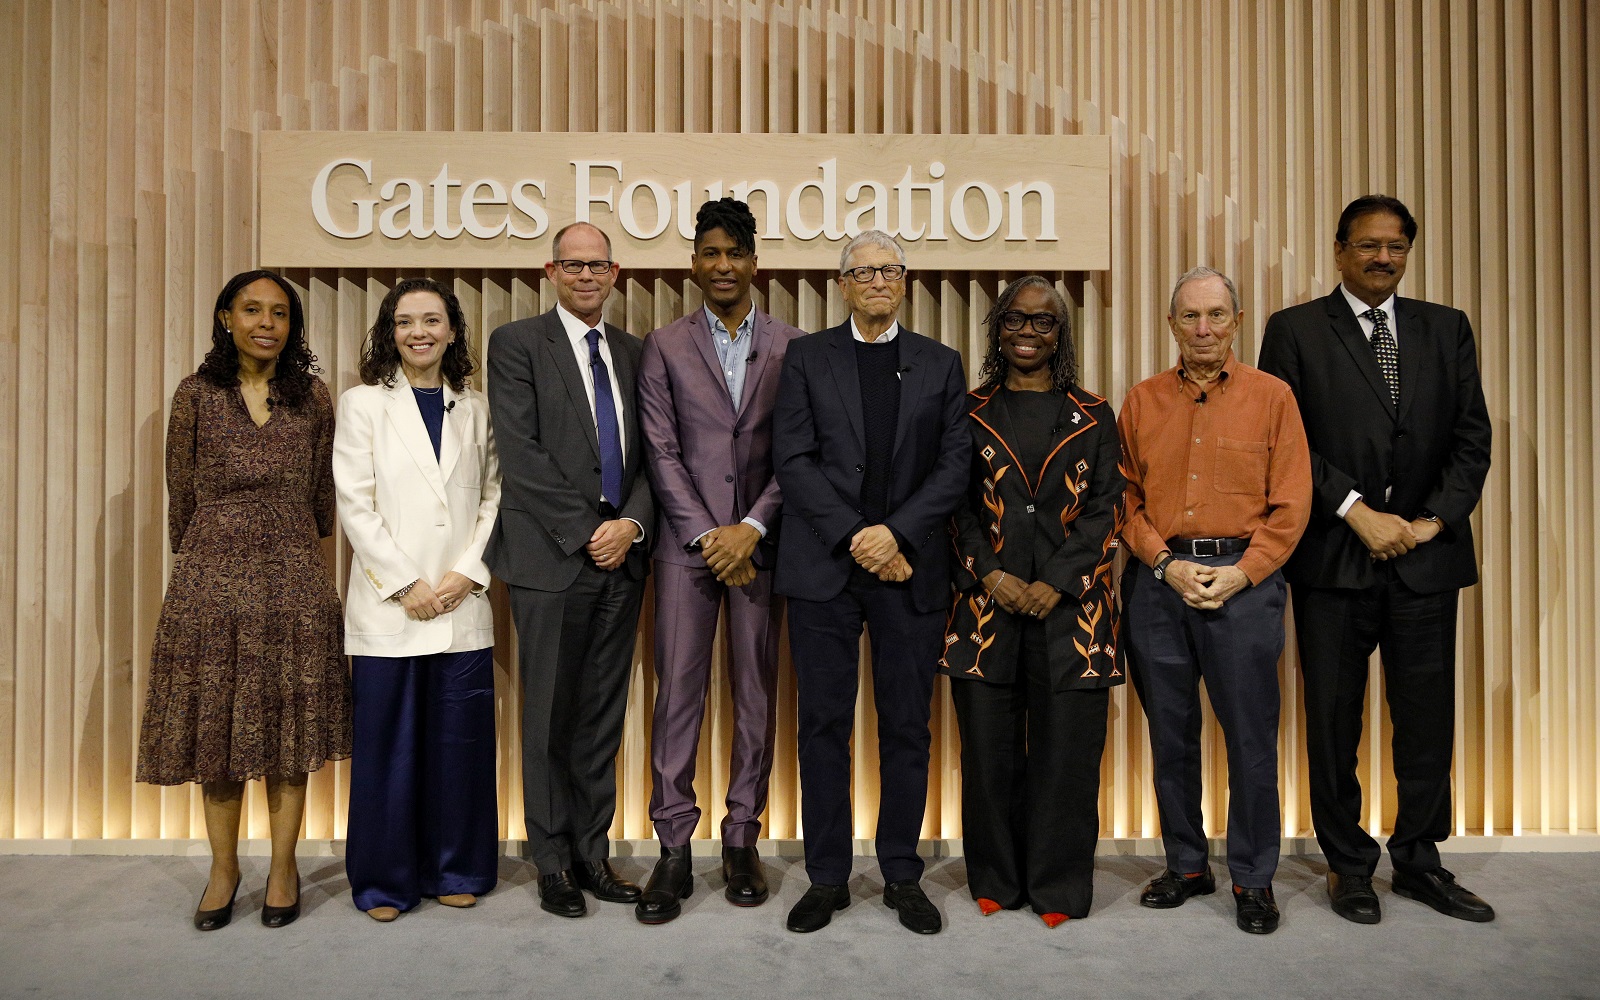
Cari Tuna
Cari Tuna joined Bill Gates and other philanthropic leaders in New York to mark 25 years of the Gates Foundation. In her remarks, she reflected on how the Foundation’s evidence-driven approach to tackling global health challenges has inspired Good Ventures’ own work.
Stanford PACS Philanthropy Innovation Summit 2025
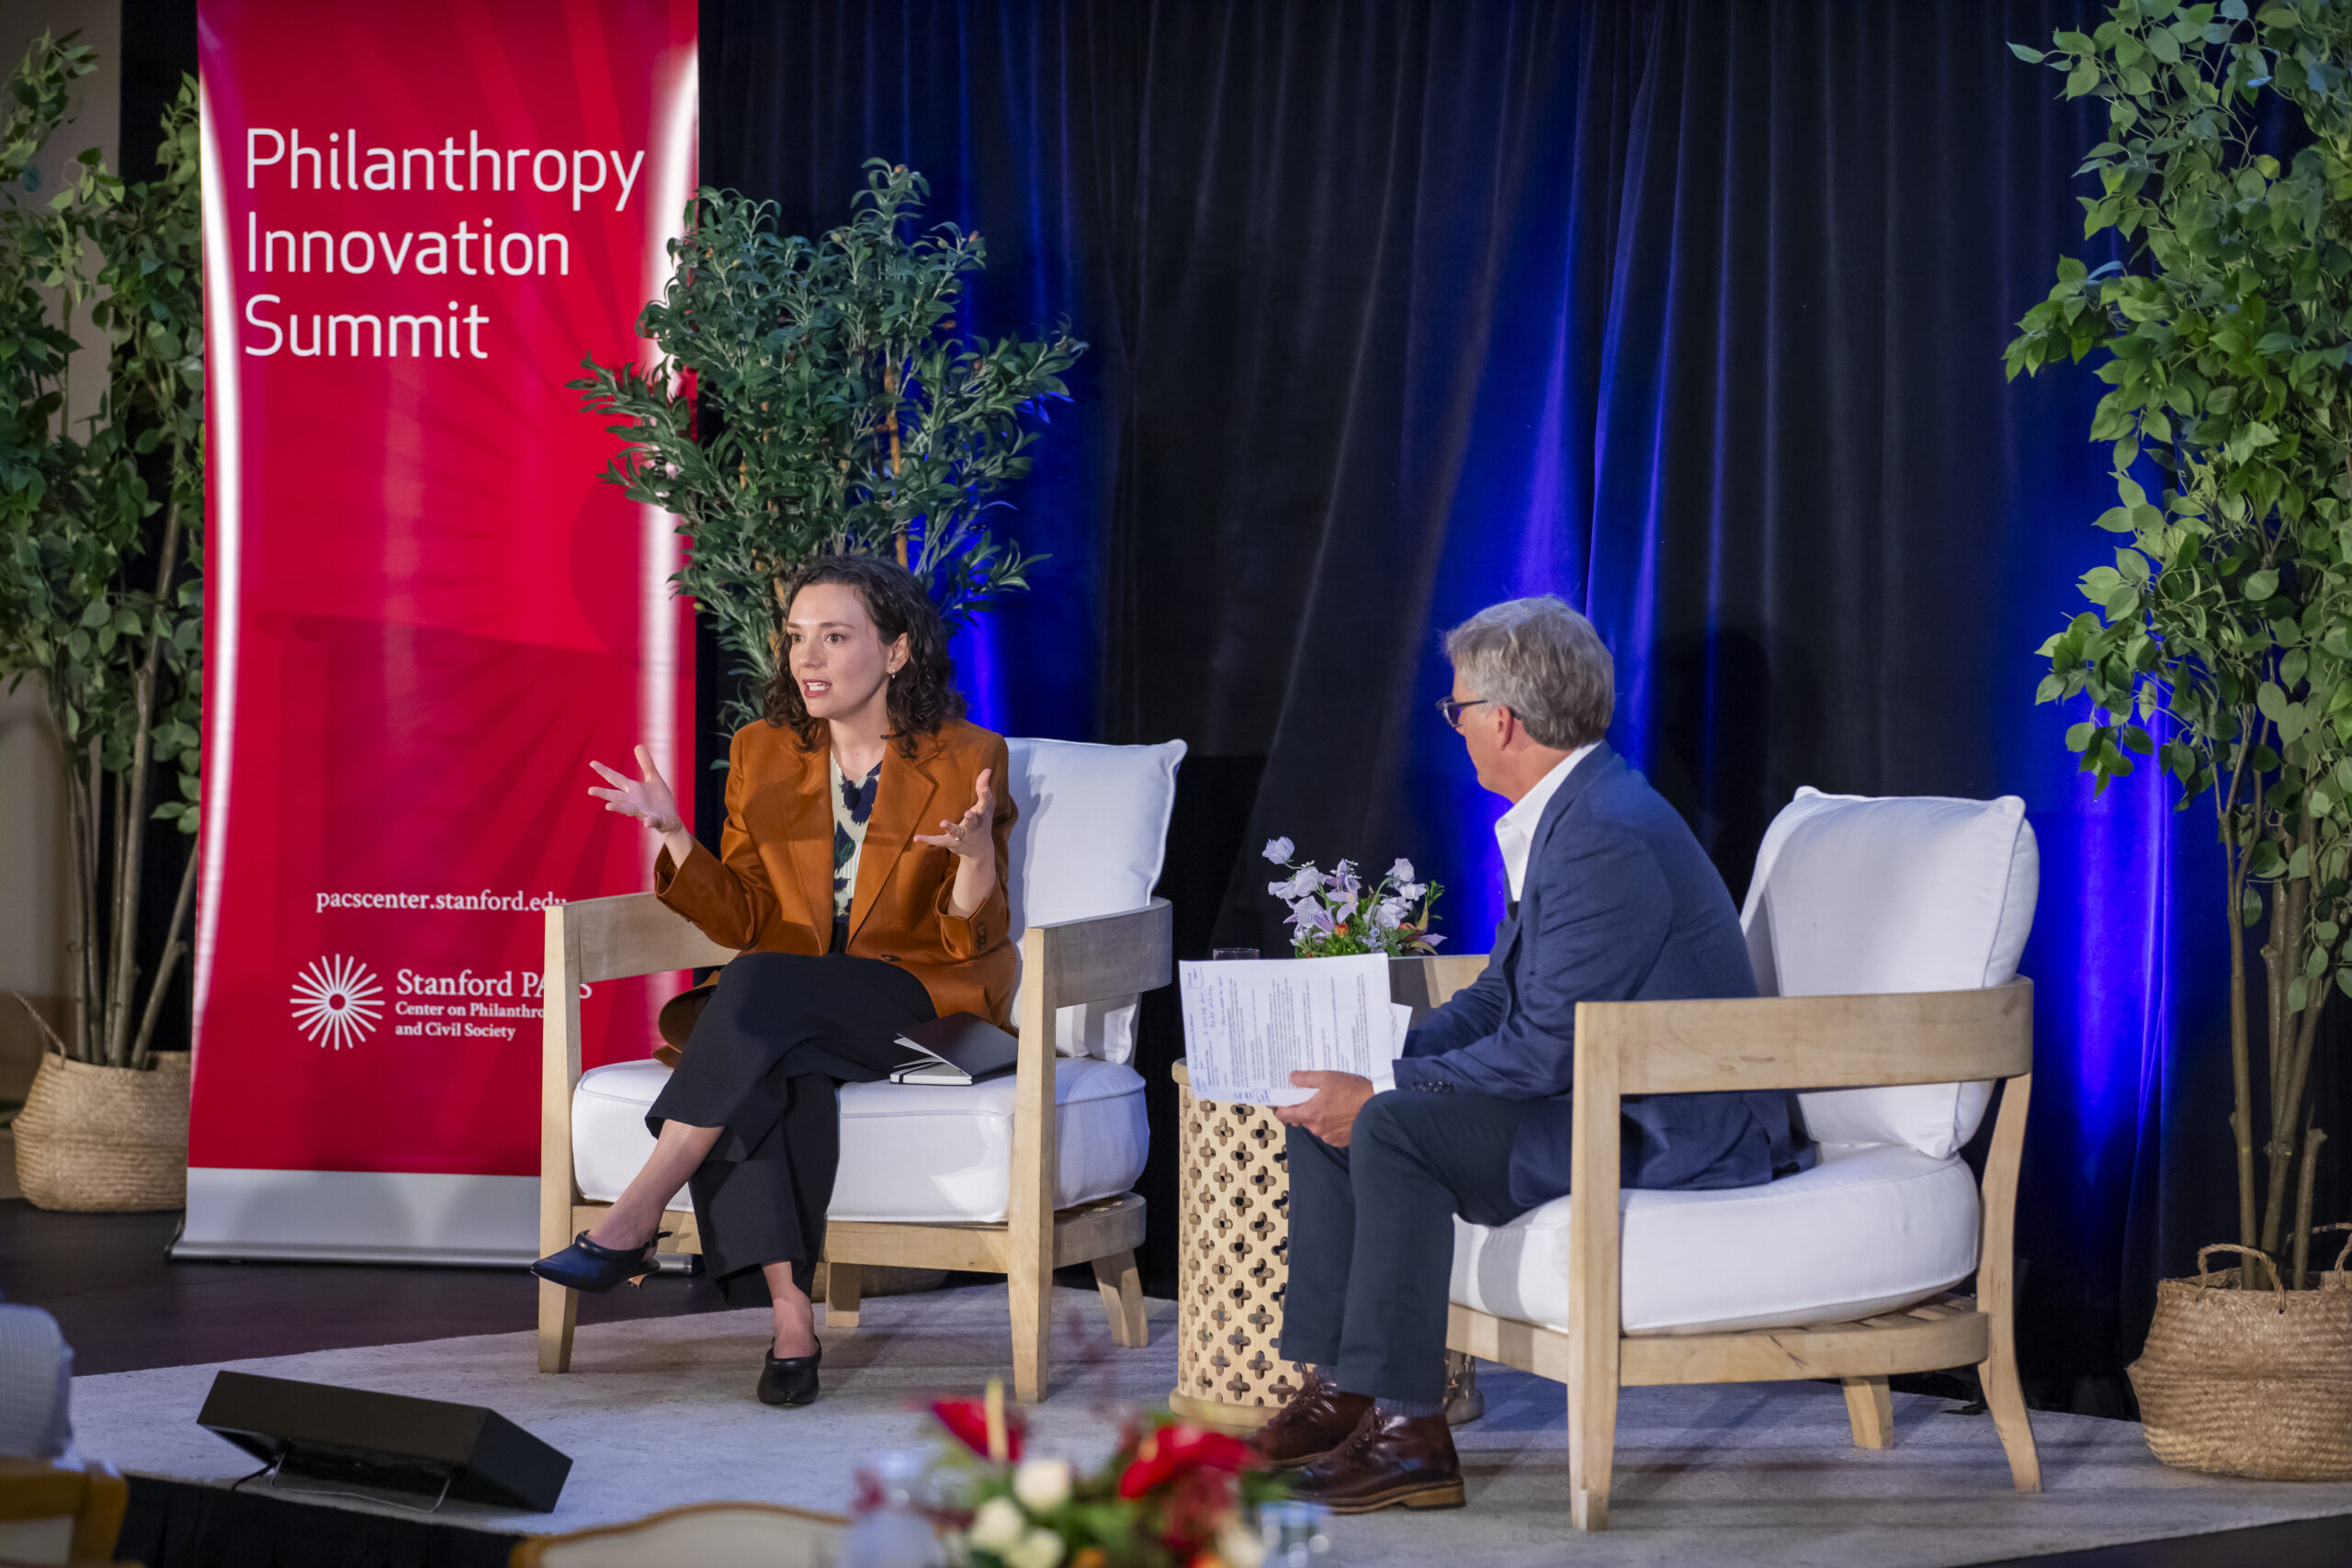
Cari Tuna
During a fireside chat, Cari Tuna spoke with Rob Reich, professor of political science at Stanford, about choosing causes strategically, the value and limitations of quantifying impact, and bringing together donors to tackle important, neglected problems like lead poisoning.
Works in Progress: The Long Journey to Doing Good Better

Dustin Moskovitz
In this essay, Dustin Moskovitz reflects on what he’s learned over 15 years of philanthropy, from the difficulty of choosing focus area to understanding that doing good is less about finding perfect answers and more about embracing uncertainty and humility.